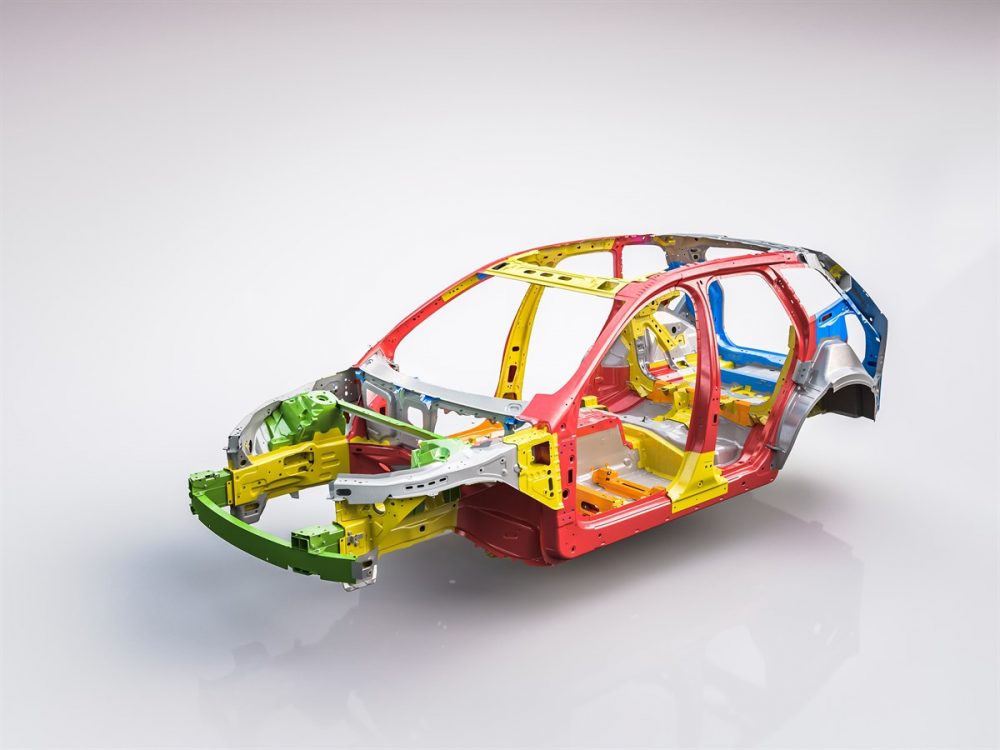
Crashworthiness is the ability of a structure to protect its occupants during an impact. This is commonly tested during the safety of aircraft or vehicles. Depending on the nature of impact and the vehicle involved different criteria’s are followed. Crashworthiness can be assessed either by using computer software such as Radioss, LS-Dyna or through experiments. Several criteria are used to assess crashworthiness prospectively including the deformation pattern of the vehicle structure, the acceleration experienced by the vehicle, the force transfer to various links of BIW etc. The injury criteria is defined using various mechanical parameters like force, acceleration or deformation. In this article, the frontal crash analysis of a reduced neon car model will be explained.
Methods
- CAD model importing
- Interface and kinematic conditions
- Simulation
- Results
Software
- Hypermesh
- Hypercrash
- Hypergraph
- Hyperview
Setting Up
A reduced model of a neon car file (.rad) was chosen due to the node limitation.
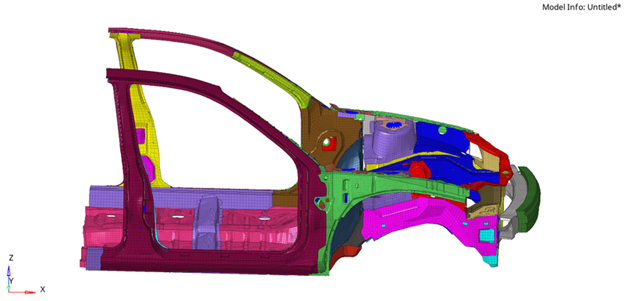
To set the interface, the file was open in hypercrash. A single type 7 interface was defined. Type 7 interface is a general type interface that can simulate impact between nodes and master surface.
IMPORTANT INTERFACE PARAMETERS
lgap:-Determines how the size of the gap is calculated
Gap_min-Minimum Gap for activation
Inacti:- Action to take if initial penetration exists
lstf:-Action how the stiffness is calculated
St_min:-Minimum stifnnes used in the iterface
ldel:-What to do if elements and master segment fails
Initial velocity was 35 mph, and rigid wall friction coefficient was 0.1. As we are only dealing with the frontal part of the BIW total mass of the structure is less compared to the original model.Mass plays a crucial role in the analysis.. Hence additional masses were added to the model to bring the COG to a respectable position.
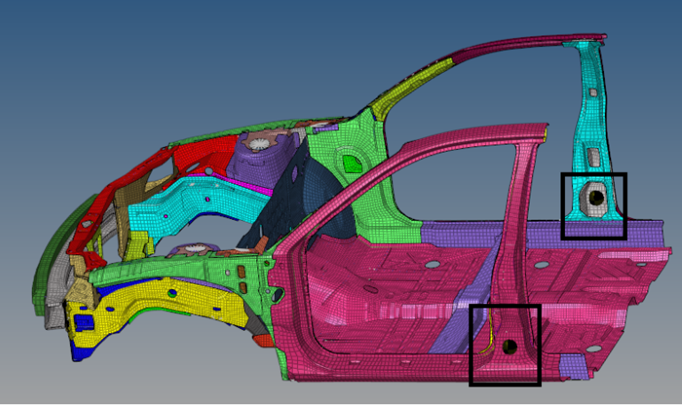
Accelerometers were created on rockers on the near part of the B-pillar. For the defined accelerometers we define its output block to get its respective outputs in post-processing stage. The run time was set to 80ms.
Results
Now we can post-process our results using Hyperview and hypergraph. Hyperview helps to get useful animation contours and hypergraph helps to plot the required data
The simulation was run successfully. Here the mass error and energy errors are within acceptable ranges hence we procced further.In the crash animation, we can see the front of the car to rise, it maybe due to the mass addition we did.
Crash animations in various orientations
Von Mises Stress
Von mises stress is very important in understanding the stresses that are acting upon BIW fixtures when car crash occurs. It is important for stress to flow from one component so that stresses can be absorbed by different car components so as to ensure maximum safety for passengers. The maximum von mises stress observed is 0.3657 GPa.
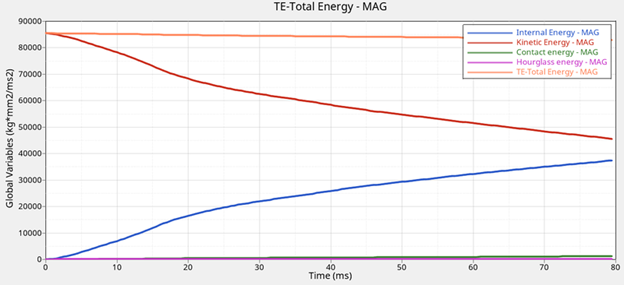
Energy Plots
The plot shows a decrease in Kinetic energy and an increase in Internal Energy after occurrence of impact.The total energy has been same throughout. The choice of proper element formulation has helped to keep hourglass energy to a very negligible value. The contact energy can be seen increasing across the run with an increase in deformation thus resulting in increase in contact.
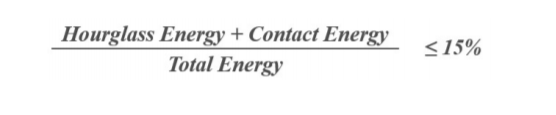
Ideally, it is recommended that;
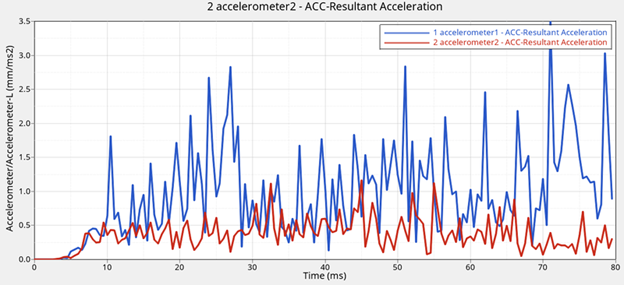
The Acceleration
The plot shows the acceleration measured by accelerometers placed at the rocker arms at the bottom of B-pillars. Accelerations become non zero after the impact.The accelerometer on left side that is represented by blue curve has recorded more variation and peaks which has a max value of 3.48 whereas right sided recorded a max of 1.16.
For more information about this analysis please contact with the author.