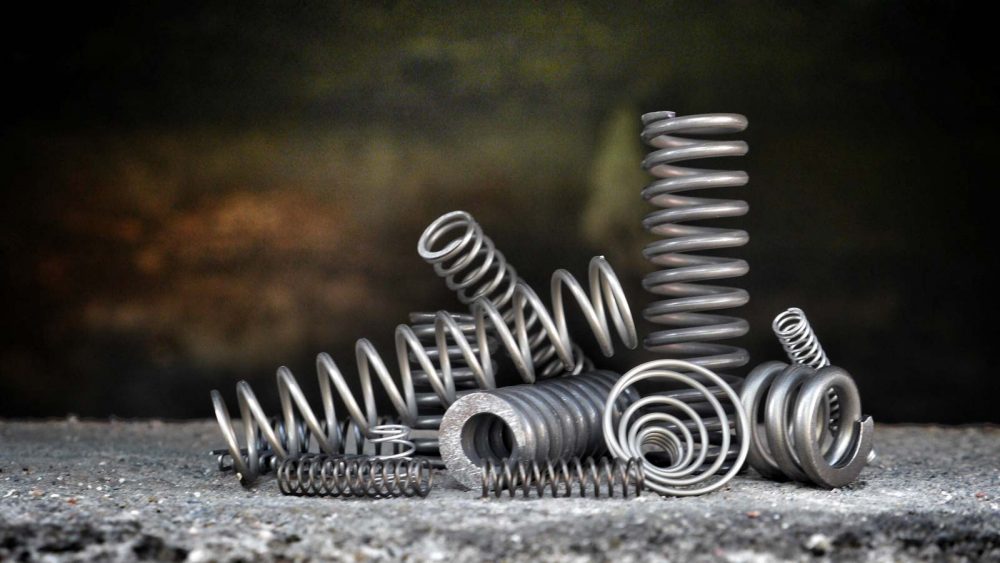
Springs are often used as structural components in industrial machines and also in daily used constructions at home – e.g. garden swings.
The main functions of spring are exerting a force, accumulating and dissipating energy. Due to the method of loading, springs can be divided into 4 main types: tension, compression, torsion and bending. There are also divisions according to the pitch of the winding, the shape of the winding and others.
Background
Force generated by a linear spring can be expressed as follow in Eq1:
F=-k\Delta x
where F is force (N), k is spring constant (N/mm) and x is displacement (mm).
After transforming equation 1. it can be noticed that spring constant is a ratio of force generated in spring to its elongation. It can be written as below in Eq2:
k=\frac{F}{\Delta x}Above equation 2. describes the generic case. After taking into account spring’s geometry and its material, equation 2. can be formulated as below in Eq 3:
k=\frac{F}{\Delta x}=\frac{G d^{4}}{8D^{3}n}where G is shear modulus (MPa), d is wire diameter (mm), D is mean diameter (mm) and n is the number of working windings.
The Goal and Assumptions
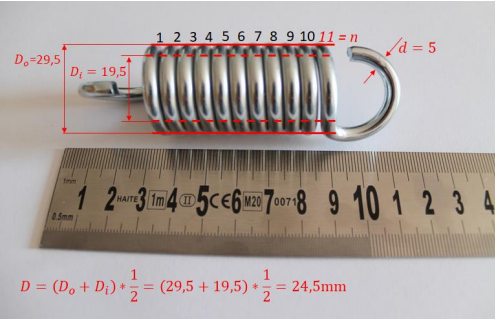
The aim of the study was to determine the spring constant k by hand calculations and prove
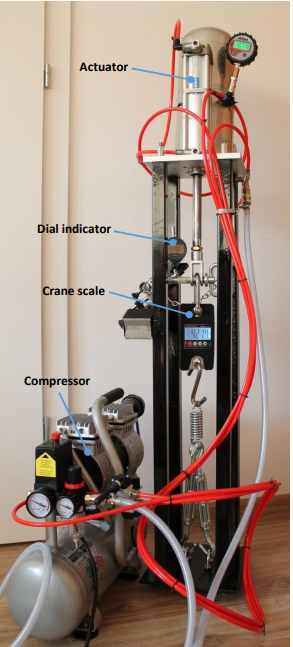
the results by experimental validation. The tension spring presented in the picture below has been examined. Material of the spring – stainless steel 𝐺 = 80769 𝑀𝑃a.
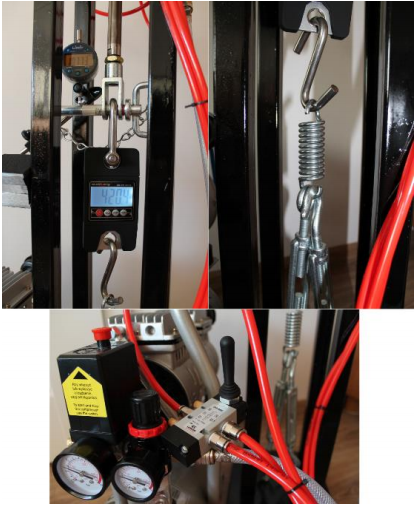
To achieve the goal a test stand has been designed and built. The test stand is based on a pneumatic actuator powered up by a compressor. Force is measured by a digital crane scale. Displacement is measured by a dial indicator. Following Fig. 2 and Fig. 3 present the test stand.
Results and Discussions
Theory
After substituting the geometrical data of the spring (Fig.1) to the formula in Eq 3., the
following is obtained:
k==\frac{G d^{4}}{8D^{3}n}=\frac{80769 . 5^{4}}{8.24,5^{3}.11}=39 N/mmThe result of k=39N/mm can be interpreted that the spring elongates 1mm under 39N of force.
Experimental
Seven measurements of force and displacement have been done to create characteristics. The measurement was done in the 0 to 8.3mm displacement range of the spring. The data has been collected in the chart in figure 4. The linear approximation has been used to obtain the slope factor of the curve which corresponds to the spring constant. Measurement uncertainty has been skipped.
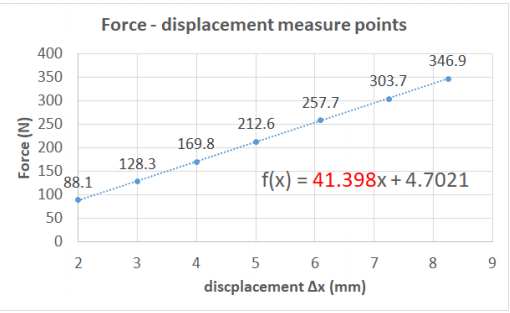
From linear approximation (fig.4) of data points,a linear function has been obtained in Eq 5:
𝐹𝑜𝑟𝑐𝑒 = 41.398𝑥 + 4.7021
Intercept constant 4.7021 in equation 5. should be equal to 0 in the theoretical approach. In the performed measurement intercept constant >0 could be caused by too high initial tension in crane scale or not tared device.
Relative error has been calculated to evaluate results accuracy :
\delta=\frac{\Delta x}{x}=\frac{|x-x_{0}|}{x}=\frac{|39-41.4|}{39}=6.2 \%Summary
Results obtained in the experiment measurement in subjective opinion can be considered satisfactory taking into account the project assumption – optimal price accuracy ratio. Stiffness data can be used to further analysis e.g. Finite Element Analysis.